Horse Racing Odds Explained: Formats, Margins, and What the Numbers Hide
Loading...
Horse racing generated £766.7 million in gross gambling yield from remote betting across April 2024 to March 2025. Every pound of that GGY came through odds — numbers that most punters glance at, compare loosely, and then bet on without ever examining how they’re built. I spent my first two years betting on racing treating odds as labels: 5/1 meant “good price,” 2/1 meant “short.” It took a costly losing run for me to sit down and understand what the numbers actually encode.
Odds are a translation of probability into price, wrapped in a margin that pays the bookmaker. They tell you what the market thinks about a horse’s chance of winning, but they tell you that in a language that overstates the total probability of all outcomes combined — and that overstatement is where the bookmaker’s profit lives. Understanding the format, the calculation, and the margin isn’t academic. It’s the difference between being a punter who reads prices and a punter who reads value.
This article takes you from fractional odds through decimals, the starting price mechanism, implied probability, the overround, odds movements, and the exchange alternative. By the end, you’ll understand not just what a price means but what it hides.
Fractional Odds: The Traditional UK Format
Walk into any betting shop in Britain — the 5,825 that remain — and the odds on the board will be fractional. It’s the format the sport was built on, and despite the rise of decimals in exchange betting and European markets, fractions remain the default language of UK racing.
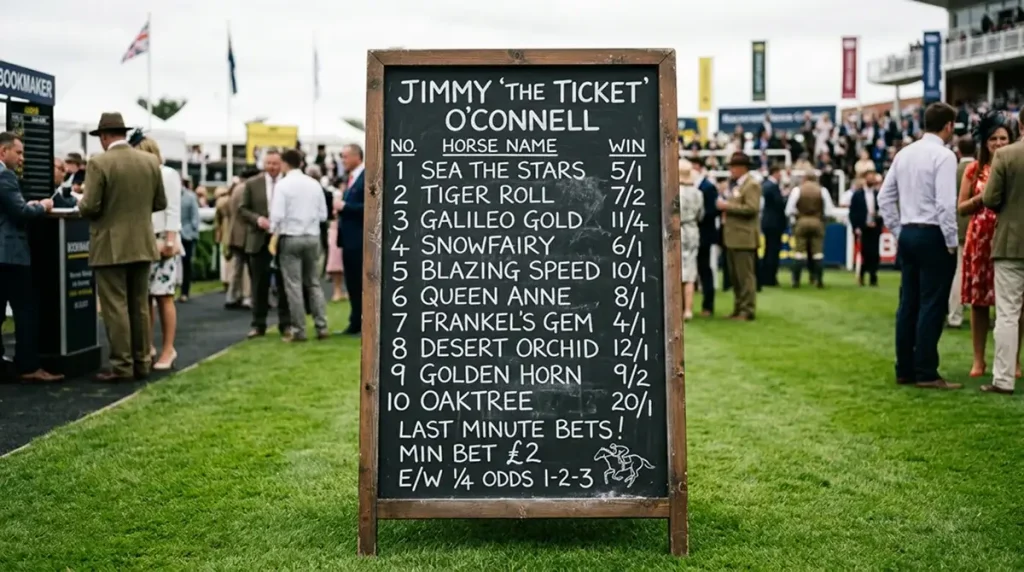
A fractional price of 5/1 (spoken as “five to one”) means that for every £1 you stake, you receive £5 in profit if the horse wins, plus your £1 stake returned. Total return on a £1 bet: £6. A price of 7/2 means £7 profit for every £2 staked — so a £10 bet returns £45 (£35 profit plus £10 stake). The numerator is your profit, the denominator is your stake, and the total return is always the sum of both plus the original stake.
Where fractional odds trip people up is with prices like 11/8 or 13/8. These are between evens (1/1) and 2/1, and the mental arithmetic is clunkier. At 11/8, an £8 stake returns £11 profit plus £8 stake = £19. For a £10 bet, you’d calculate: (11/8) x £10 = £13.75 profit, total return £23.75. It’s perfectly manageable once you’ve practised, but it’s not as instantly readable as 3/1 or 10/1.
Odds-on prices — where the denominator is larger than the numerator — indicate a horse that the market rates as more likely to win than to lose. A price of 4/6 means you stake £6 to win £4 profit. The horse is considered the likely winner, and the price reflects that. Odds-on favourites win often enough to justify the short price, but the returns are thin, and a single loss can wipe out several wins’ worth of profit. I rarely back horses at shorter than 4/5 because the margin for error is just too small relative to the reward.
The beauty of fractional odds, despite their quirks, is that they express the bookmaker’s opinion in human-readable terms. “Ten to one” tells you immediately that the horse is an outsider. “Evens” tells you it’s a coin flip in the market’s view. “Two to one on” tells you the market considers it a strong favourite. That readability is why fractions persist in UK racing even as the industry digitises. They carry information in a way that feels intuitive to anyone who’s been around a racecourse.
Decimal Odds: The Easier Calculation
If I’m doing quick calculations on a busy afternoon with multiple races to assess, I switch to decimals in my head. The maths is faster: multiply your stake by the decimal odds, and you get your total return. That’s it. No separate profit calculation, no adding the stake back on.
A decimal price of 6.0 is the equivalent of 5/1 fractional. Stake £10 at 6.0, your return is £60. A decimal of 3.5 equals 5/2 fractional. Stake £10, return £35. The conversion formula is simple: divide the fractional numerator by the denominator, then add 1. So 7/2 becomes (7 divided by 2) + 1 = 4.5. Evens (1/1) is 2.0 in decimal. Odds-on prices fall between 1.0 and 2.0 — a price of 1.5 in decimal equals 1/2 fractional.
Decimal odds are the standard on betting exchanges and across most European markets. If you bet on exchanges at all — and as an odds-conscious punter, you should at least understand them — decimals are what you’ll see. They also make it easier to compare prices across multiple runners quickly, because the relationship between decimal odds is linear. The gap between 4.0 and 5.0 represents the same thing as the gap between 8.0 and 9.0: one additional unit of stake return. In fractional terms, the gap between 3/1 and 4/1 looks the same as the gap between 7/1 and 8/1, but the percentage difference in implied probability is actually larger at shorter prices.
Most UK betting sites allow you to toggle between fractional and decimal display in your account settings. My recommendation: learn to read both fluently. Fractional for quick race-day assessment and conversation, decimal for calculations and exchange betting. They express the same information in different languages, and being bilingual gives you an edge in speed and accuracy.
Starting Price (SP): How It Forms and When It Applies
The starting price — SP — is one of the most misunderstood elements of UK racing. Punters see it on their betting slip and assume it’s just “the price at the off.” It is, but how that price forms is a process with its own logic, and understanding that process tells you things about the race that the odds themselves don’t.
The SP is determined by official SP reporters at the racecourse in the moments before the race begins. These reporters survey the prices being offered by on-course bookmakers — the individuals standing in the betting ring with their boards — and calculate a representative price based on the balance of money available. The SP reflects what on-course bookmakers are willing to lay at the point of the off, not the volume of online bets placed that morning.
This creates an interesting dynamic. The morning prices you see on betting sites are set by the operator’s trading team, based on their models and the early market activity. As the day progresses, on-course money arrives and shifts the market. Stable money — insider information, trainer confidence, significant punter activity — typically shortens a horse’s price. Drift — a horse’s price getting longer — often signals lukewarm support or negative intelligence (the horse didn’t eat up, the ground has changed, connections aren’t confident). The SP captures the final state of that information flow.
Average turnover per race on Premier fixtures grew 2.7% in 2025, while it fell 8.6% on Core fixtures. Premier meetings attract more on-course betting activity, which means the SP formation process on big Saturdays involves more money and more informed participants than on a wet Wednesday at a minor track. The SP on a Premier fixture is, in effect, a more efficient price — it’s been tested by a deeper pool of money. On quieter cards, the SP can be more volatile and less reflective of a horse’s true chance, because the on-course market is thinner.
Best Odds Guaranteed policies use the SP as the comparison point. If the SP is larger than the price you took, you’re paid the SP. If it’s smaller, you keep your original price. This makes understanding SP formation practically valuable: if you expect a horse’s price to drift (lengthen) as the off approaches — perhaps because you think the public will be drawn to a more fancied rival — taking an early price and letting BOG protect your upside is a sensible play. If you think a horse will shorten, locking in the current price early captures value that won’t be available at SP.
Turning Odds into Implied Probability
Every set of odds implies a probability. A horse at 3/1 (decimal 4.0) carries an implied probability of 25%. A horse at evens (decimal 2.0) carries an implied probability of 50%. The conversion is straightforward: divide 1 by the decimal odds. For fractional, divide the denominator by the sum of numerator and denominator. At 3/1: 1 divided by (3+1) = 0.25, or 25%.
This is the bridge between odds and reality. When you see a horse priced at 4/1, the market is saying — after margin — that this horse has roughly a 20% chance of winning. If you think the true chance is 30%, the price is offering you value. If you think it’s 15%, the price is too short. The entire discipline of value betting rests on this conversion, which is why I’m walking through it explicitly rather than assuming it’s obvious.
The trap is that implied probabilities from bookmaker odds always sum to more than 100%. In a five-runner race, if you convert every horse’s fractional odds to an implied probability and add them up, you’ll get something like 115% or 120%, not 100%. That excess is the overround — the bookmaker’s margin — which I’ll cover in the next section. The point here is that the implied probability of any individual horse is slightly overstated. A horse at 3/1 doesn’t truly have a 25% chance in the market’s view; the real market probability is a bit lower, with the difference being the bookmaker’s cut.
To get the “true” implied probability, you can normalise: divide each horse’s individual implied probability by the total of all implied probabilities. If the total overround is 118% and a horse’s raw implied probability is 25%, the normalised probability is 25/118 = 21.2%. This normalised figure is closer to what the market actually believes. It’s a small adjustment, but over hundreds of bets, thinking in normalised probabilities sharpens your assessment of which prices offer genuine value and which are merely reflecting the margin.
The Overround: How Bookmakers Build Their Edge
The overround is the mechanism that keeps the lights on at every bookmaker. It’s the gap between 100% and the total implied probability of all runners in a race, and it represents the bookmaker’s theoretical profit margin if they balance their book perfectly.
Take a simple three-horse race. The bookmaker prices them at 2/1, 5/2, and 3/1. The implied probabilities are: 33.3%, 28.6%, and 25.0%, totalling 86.9%. Wait — that’s under 100%, which would mean the bookmaker is offering an overbroke book (where punters have an inherent edge). In practice, this doesn’t happen. Real-world prices for a three-horse race would be tighter: perhaps 6/4, 2/1, and 5/2, giving implied probabilities of 40%, 33.3%, and 28.6% = 101.9%. That 1.9% over 100 is the overround.
In UK horse racing, typical overrounds range from about 112% to 125% depending on the number of runners and the competitiveness of the market. Big handicap fields with 20+ runners tend to carry higher overrounds because there are more prices to shade. Small-field Group races tend to carry lower overrounds because the market is more closely watched and competitive pressure from exchanges and rival bookmakers keeps margins tight.
Remote betting on horse racing produced GGY of £766.7 million across April 2024 to March 2025, with total remote GGY at £2.6 billion. The overround is how that yield is generated at the individual race level. Andrew Rhodes, chief executive of the UK Gambling Commission, has observed that online betting follows the pattern of large marquee events and that GGY tracks along with results — the overround produces more absolute revenue when big meetings attract higher turnover, even if the percentage margin stays the same. Online GGY across the remote sector grew 8% year on year to £1.42 billion in Q2 2025, confirming that the aggregate margin across all races sustains healthy returns for operators even as total turnover falls.
For punters, the overround is the cost of playing. You can’t eliminate it, but you can reduce your exposure to it. Comparing prices across multiple operators and taking the best available odds on each bet effectively reduces the overround you’re paying on each race. Over a season, the difference between consistently paying 120% overround and consistently paying 112% overround — achieved by shopping for the best price — is substantial. It’s the single easiest way to improve your overall return without changing your selection process at all.
Why Odds Drift and Shorten Before a Race
I once took 8/1 about a horse at 9am that went off at 3/1. The money came for it in a wave through the afternoon — stable money first, then public money following the move, then a further contraction as the on-course market reacted. By the time the stalls opened, the horse I’d backed at 8/1 was the second favourite. It won by four lengths. That’s the power of understanding why odds move and positioning yourself before the shift.
Odds shorten (get smaller) when money comes for a horse. This can be driven by several factors: positive intelligence from connections (the horse has been working well, the trainer is bullish), a confirmed jockey booking that signals intent, a going change that favours the horse, or simply large volume from professional punters who’ve assessed it as value. Shortening prices reflect increasing confidence in a horse’s chance across the market.
Odds drift (get larger) when money moves away from a horse or when the weight of money is directed at its rivals. A horse might drift because of negative intelligence (it didn’t travel well to the course, its preparation has been disrupted), a jockey change to a less experienced rider, or simply because a rival’s price has shortened and the bookmaker needs to adjust the overall book. Not every drift is a negative signal — sometimes a horse drifts because the market initially overreacted to a positive factor — but persistent drift from the morning through to the off is usually worth noting.
Betfair UK implemented predictive AI for odds setting in 2025, reducing settlement delays by 28%. That technological shift reflects a broader trend: odds formation is becoming faster and more data-driven. The window between a significant piece of information entering the market and the odds fully adjusting is narrowing. For punters, this means that acting on your own assessment quickly — taking the price you want before the market catches up — is more valuable than ever. Hesitation costs money.
Monitoring market movers — horses whose odds have shortened significantly from opening prices — is a useful supplementary tool, though not a strategy in itself. Market moves tell you what other people think, not whether those people are right. A horse that shortens from 10/1 to 4/1 might win, or it might have been backed by a well-known punter whose reputation moves the market regardless of whether the opinion is correct on that specific day. Use moves as one input alongside your own form assessment, not as a substitute for it.
Exchange Odds vs Fixed-Odds Bookmaker Prices
The betting exchange is the structural alternative to the traditional bookmaker, and understanding the difference is essential for any punter who cares about odds quality. On an exchange, you’re not betting against the house. You’re betting against other punters. The exchange provides the platform, matches bets between backers (who think the horse will win) and layers (who think it won’t), and takes a commission on winning bets — typically between 2% and 5% depending on the platform and your volume.
Because there’s no bookmaker margin built into exchange prices, the odds available are generally closer to the true implied probability. A horse that a bookmaker prices at 4/1 (decimal 5.0, implied probability 20%) might be available at 5.5 or 6.0 on the exchange, reflecting the absence of the overround. After commission, the effective return is still typically better than the best bookmaker price, though the difference narrows at shorter odds.
Flutter Entertainment — the parent company of the largest UK exchange — reported group revenue of $15.91 billion in 2025, a 17% increase on the prior year. The exchange model has proven commercially sustainable at scale, and its liquidity on UK horse racing is deep enough to accommodate most punters’ staking levels, particularly on Premier fixtures and festival meetings. On quieter cards, liquidity can be thinner, and getting your full stake matched at the price you want isn’t always possible.
The exchange also introduces a capability that bookmakers don’t offer: the lay bet. When you lay a horse, you’re betting that it won’t win. Your liability is the amount you’d have to pay if the horse does win, and your profit is the backer’s stake if it doesn’t. Laying is conceptually the opposite of backing, and it opens up trading strategies — backing a horse at one price and laying it at a shorter price to lock in profit regardless of the result. That’s exchange trading, and it’s a distinct skill set that sits between traditional punting and financial spread trading.
For more on how exchange mechanics work in practice, including commission structures and liquidity by race type, I’ve written a detailed piece on horse racing bet types explained that covers the exchange alongside every other wager type available to UK punters.
What is the difference between fractional and decimal odds?
Fractional odds express profit relative to stake: 5/1 means five pounds profit for every one pound staked. Decimal odds express total return per unit stake: the equivalent decimal is 6.0, meaning a one pound stake returns six pounds total. The conversion is straightforward — divide the fractional numerator by the denominator and add 1 to get the decimal equivalent. Fractional is the traditional UK format; decimal is standard on exchanges and across European markets.
How is the starting price determined?
The starting price is calculated by official SP reporters at the racecourse moments before a race starts. They survey the prices offered by on-course bookmakers in the betting ring and determine a representative price based on the balance of available odds. The SP reflects on-course market conditions at the time of the off, not the volume of online bets placed earlier in the day.
Why do odds change in the minutes before a race?
Odds move in response to the flow of money. When significant bets are placed on a horse — whether from professional punters, informed connections, or public sentiment — the price shortens. When money moves away, the price drifts longer. In the final minutes before a race, on-course activity intensifies as late money arrives, and bookmakers adjust their boards rapidly to balance their exposure. These late movements often carry the most informational content.
Do exchange odds include commission in the displayed price?
No. Exchange odds are displayed before commission. A horse showing at 6.0 on an exchange would return six pounds per pound staked if it wins, but the exchange then deducts commission — typically 2% to 5% — from your net profit. So at 6.0 with a 5% commission, your effective return on a one pound stake is 5.75 after the commission deduction on the five pounds profit. Always factor commission into your calculations when comparing exchange prices to bookmaker odds.
Articles
Created by the "Betting Online Horse Racing" editorial team.